The Monitors page is your catalog. As you add more URLs, a few patterns keep it manageable.
Search and filters
Use Search by name or URL to jump to a monitor. Use tabs or filters (such as Web vs API) when you only want one type of monitor in view. The toolbar also helps narrow by status or time since the last change.
Row actions
Each monitor has an actions menu (often a “more” icon on the row):
- Run now — Queue an immediate check without waiting for the schedule.
- View monitor — Open the detail page for history, diffs, and settings.
- Pause / Resume — Pause during maintenance or when you temporarily do not want scheduled runs.
- Delete — Remove the monitor permanently; history goes with it.
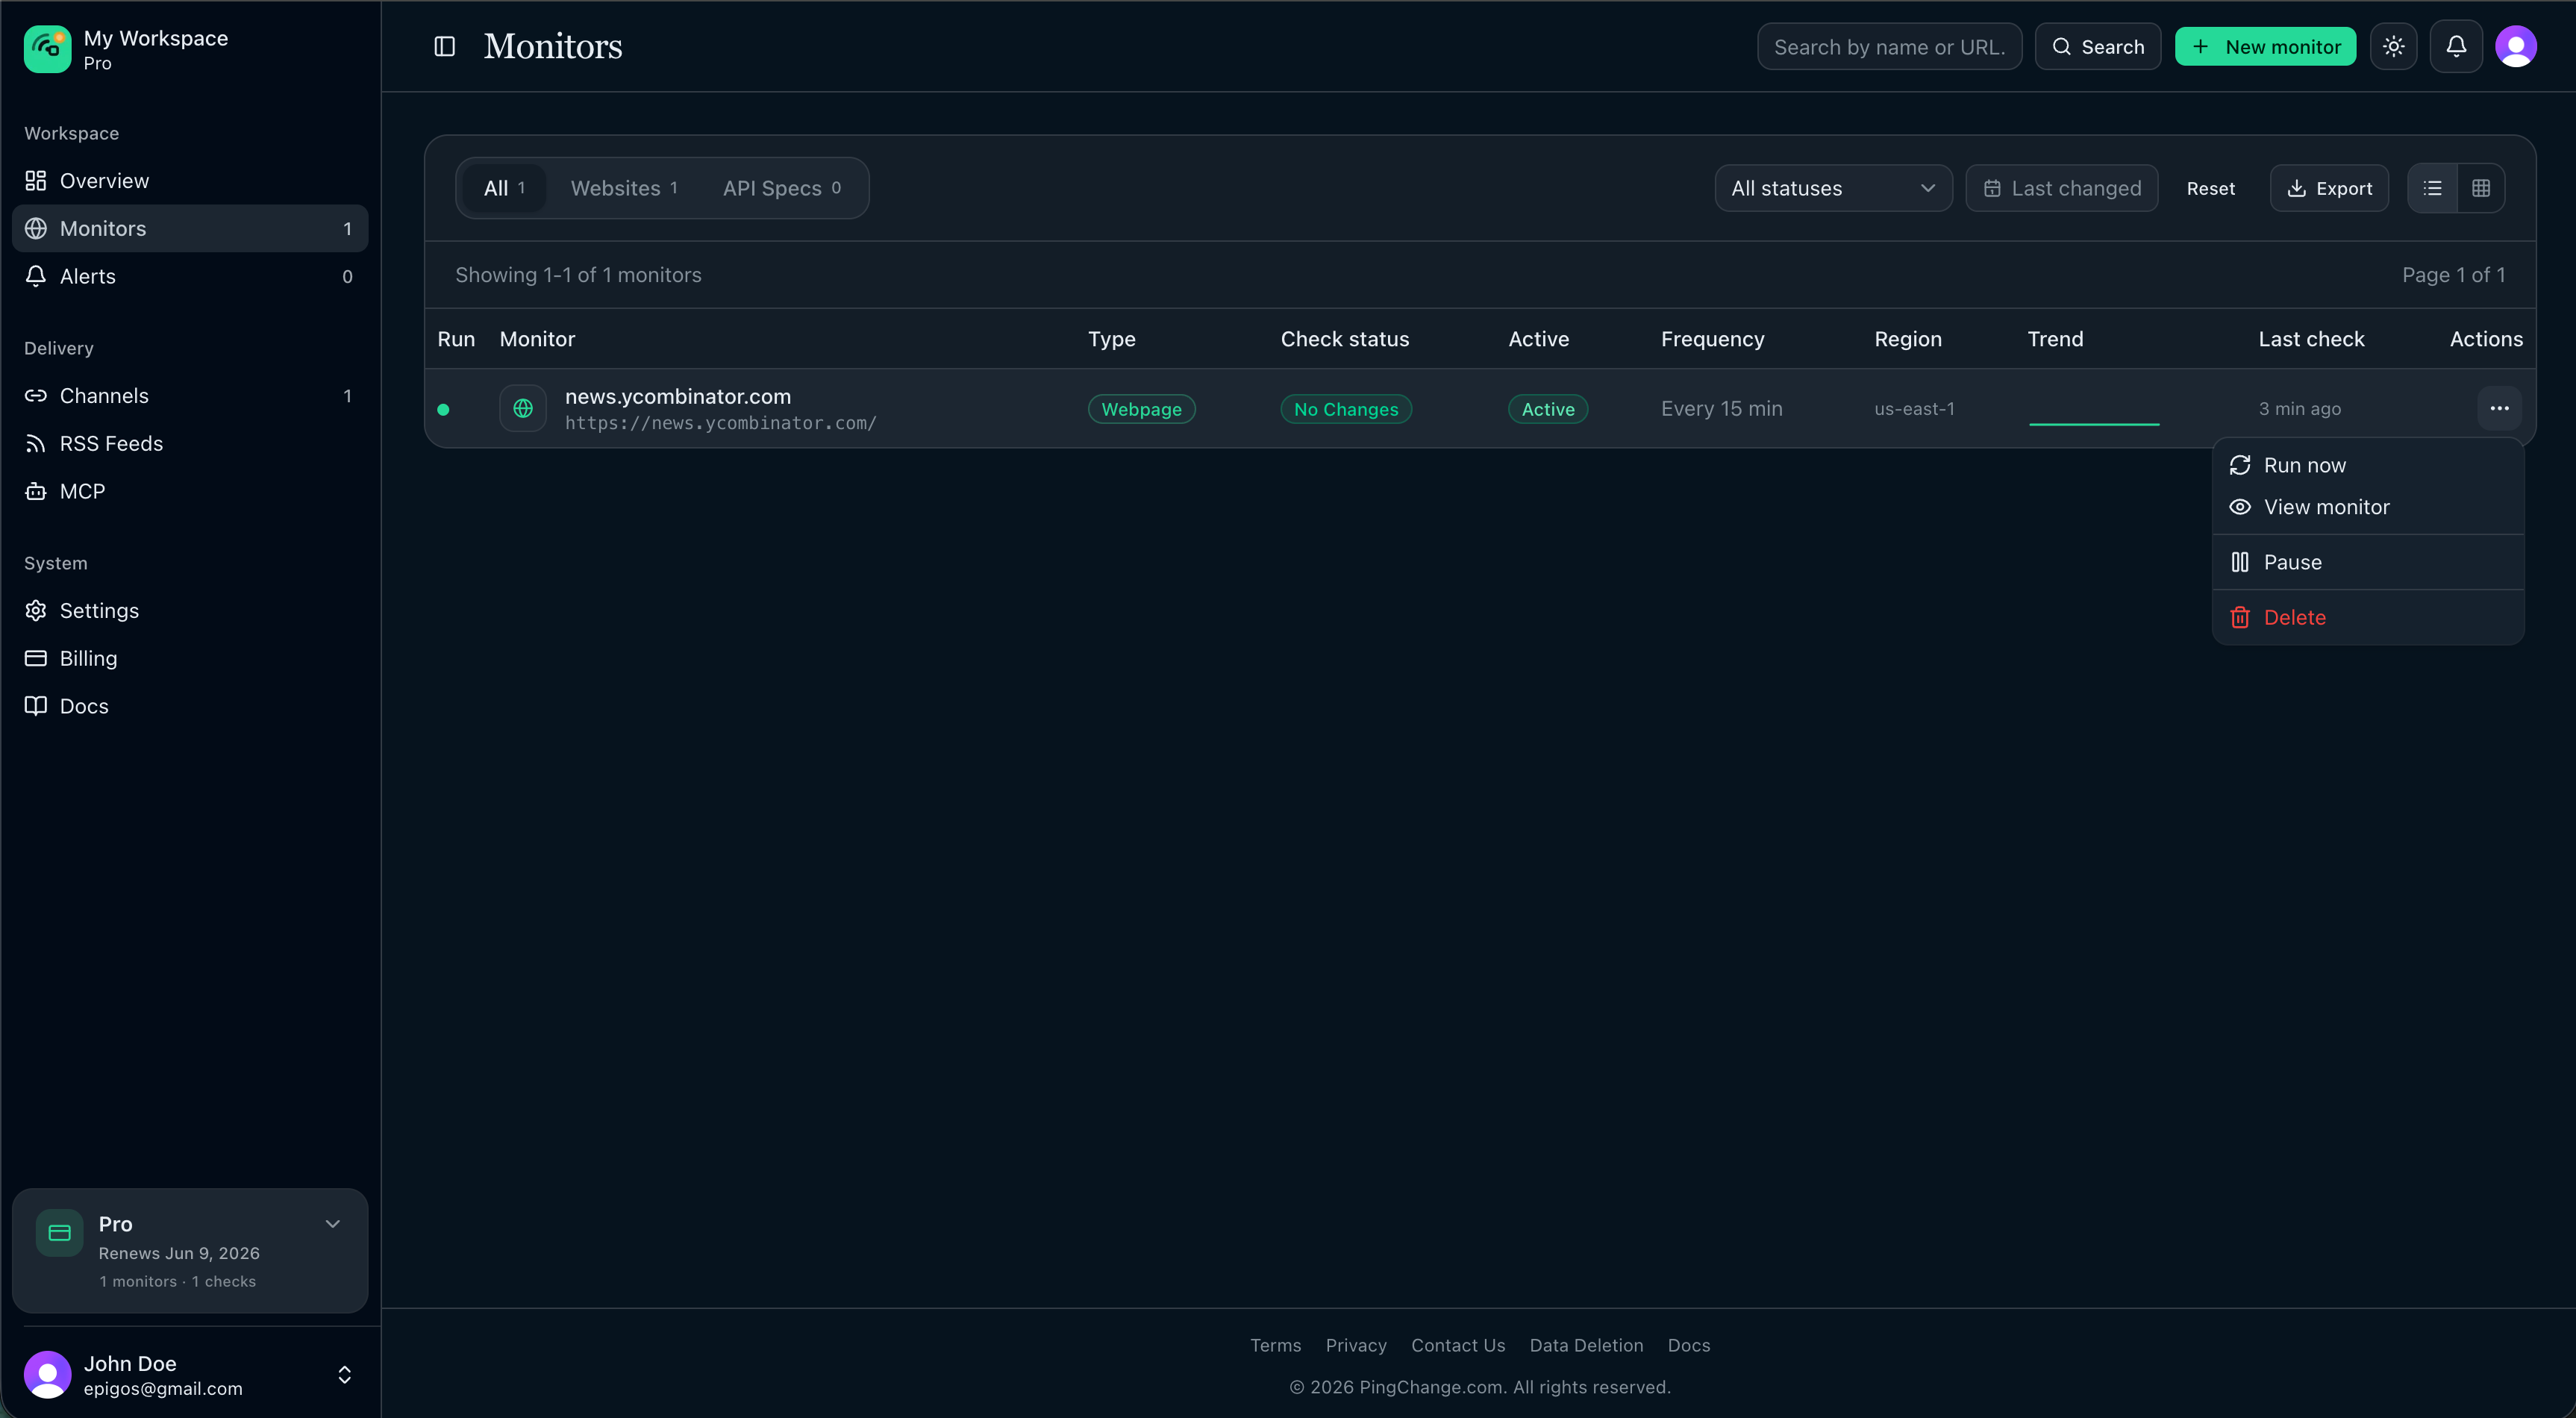
Pause is useful when a third party is redesigning a page and you expect weeks of churn; resume when you want signal again.
Monitor detail page
Open a monitor from View monitor in the row menu, or by selecting the monitor in the list. The detail page is where you work with one URL day to day.
Summary header
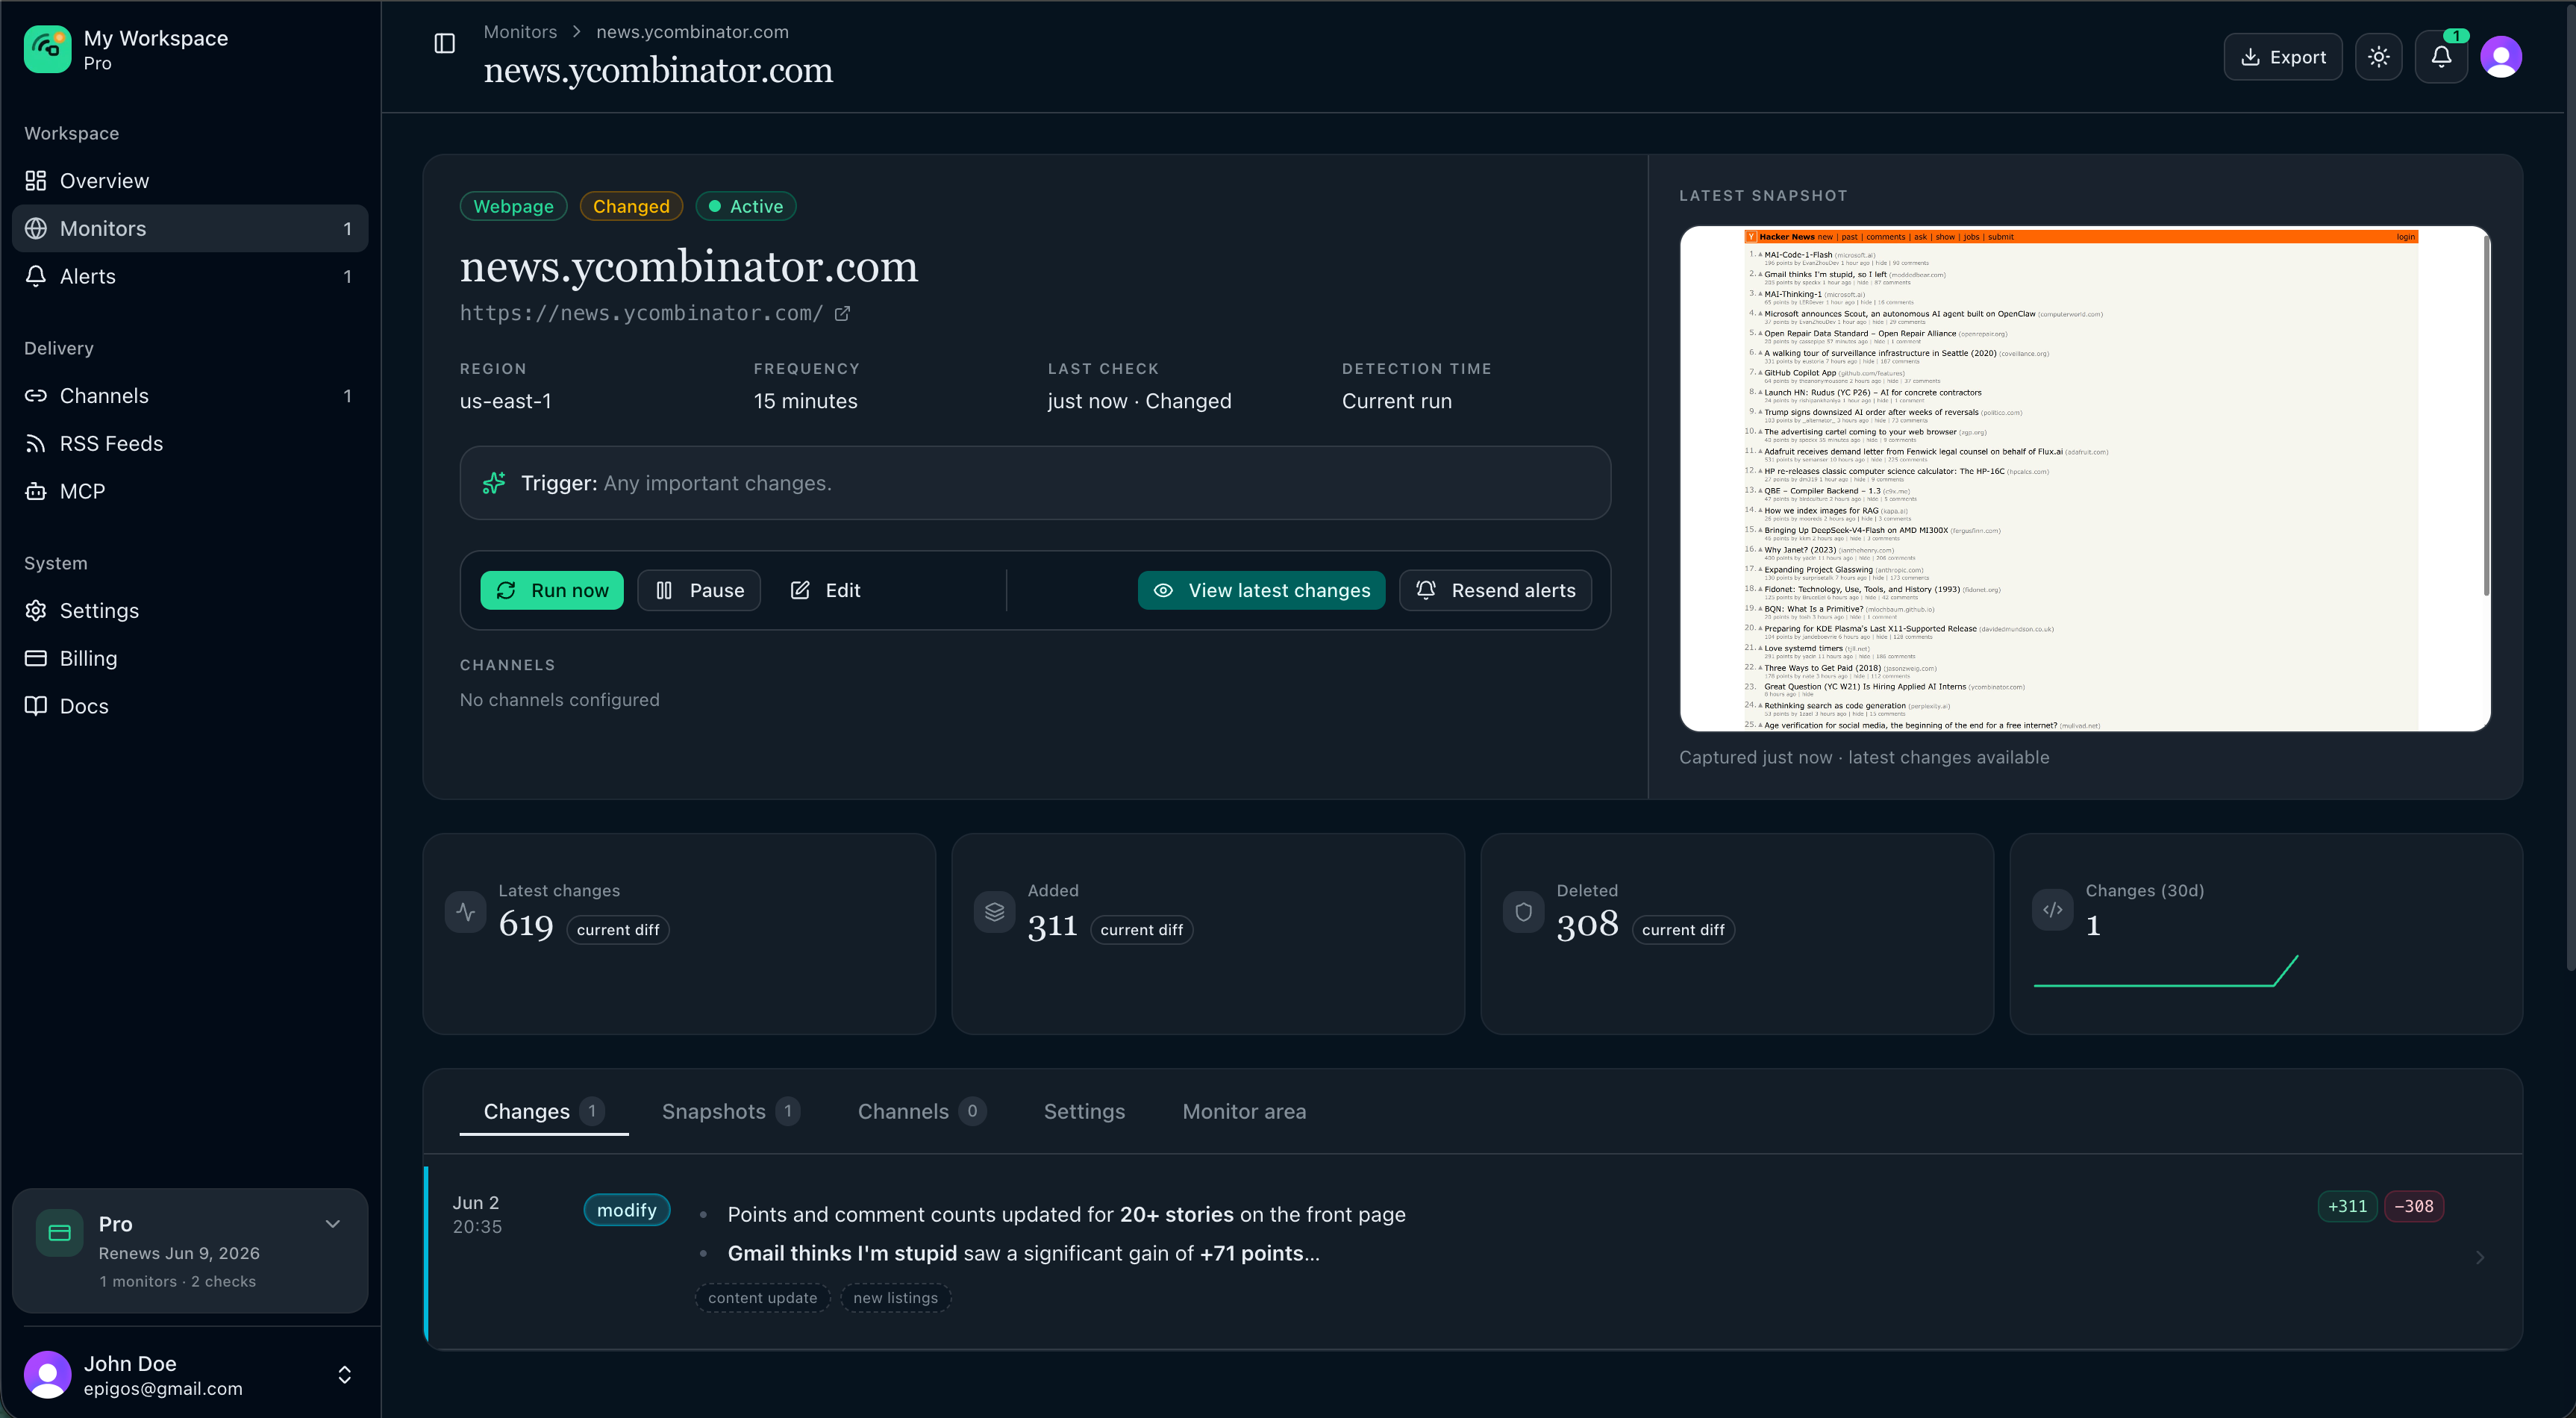
At the top you see:
- Type — Webpage or API spec.
- Status — Last check outcome (for example healthy, changed, or error).
- Active / Paused — Whether scheduled checks are running.
- Name and URL — Open the live URL in a new tab from the link.
- Region, frequency, last check — Quick facts for this monitor.
- Trigger — The AI instruction (or the default “any meaningful change” behavior).
From the header you can Run now, Pause / Resume, Edit (jumps to the Settings tab), View latest changes (opens the most recent diff when one exists), and Resend alerts for the latest change.
Tabs
Below the summary, tabs organize the rest of the page:
| Tab | What it shows |
|---|---|
| Changes | Every detected change for this monitor (default tab). |
| Snapshots | Webpage monitors only — captured screenshots over time. |
| Channels | Which notification channels are linked to this monitor. |
| Settings | Name, URL, schedule, region, sensitivity, AI instruction, delete. |
| Monitor area | Shown when you scoped the monitor to part of the page — adjust the focus region. |
The tab labels include counts (for example how many changes or linked channels) so you can see activity at a glance.
Settings tab
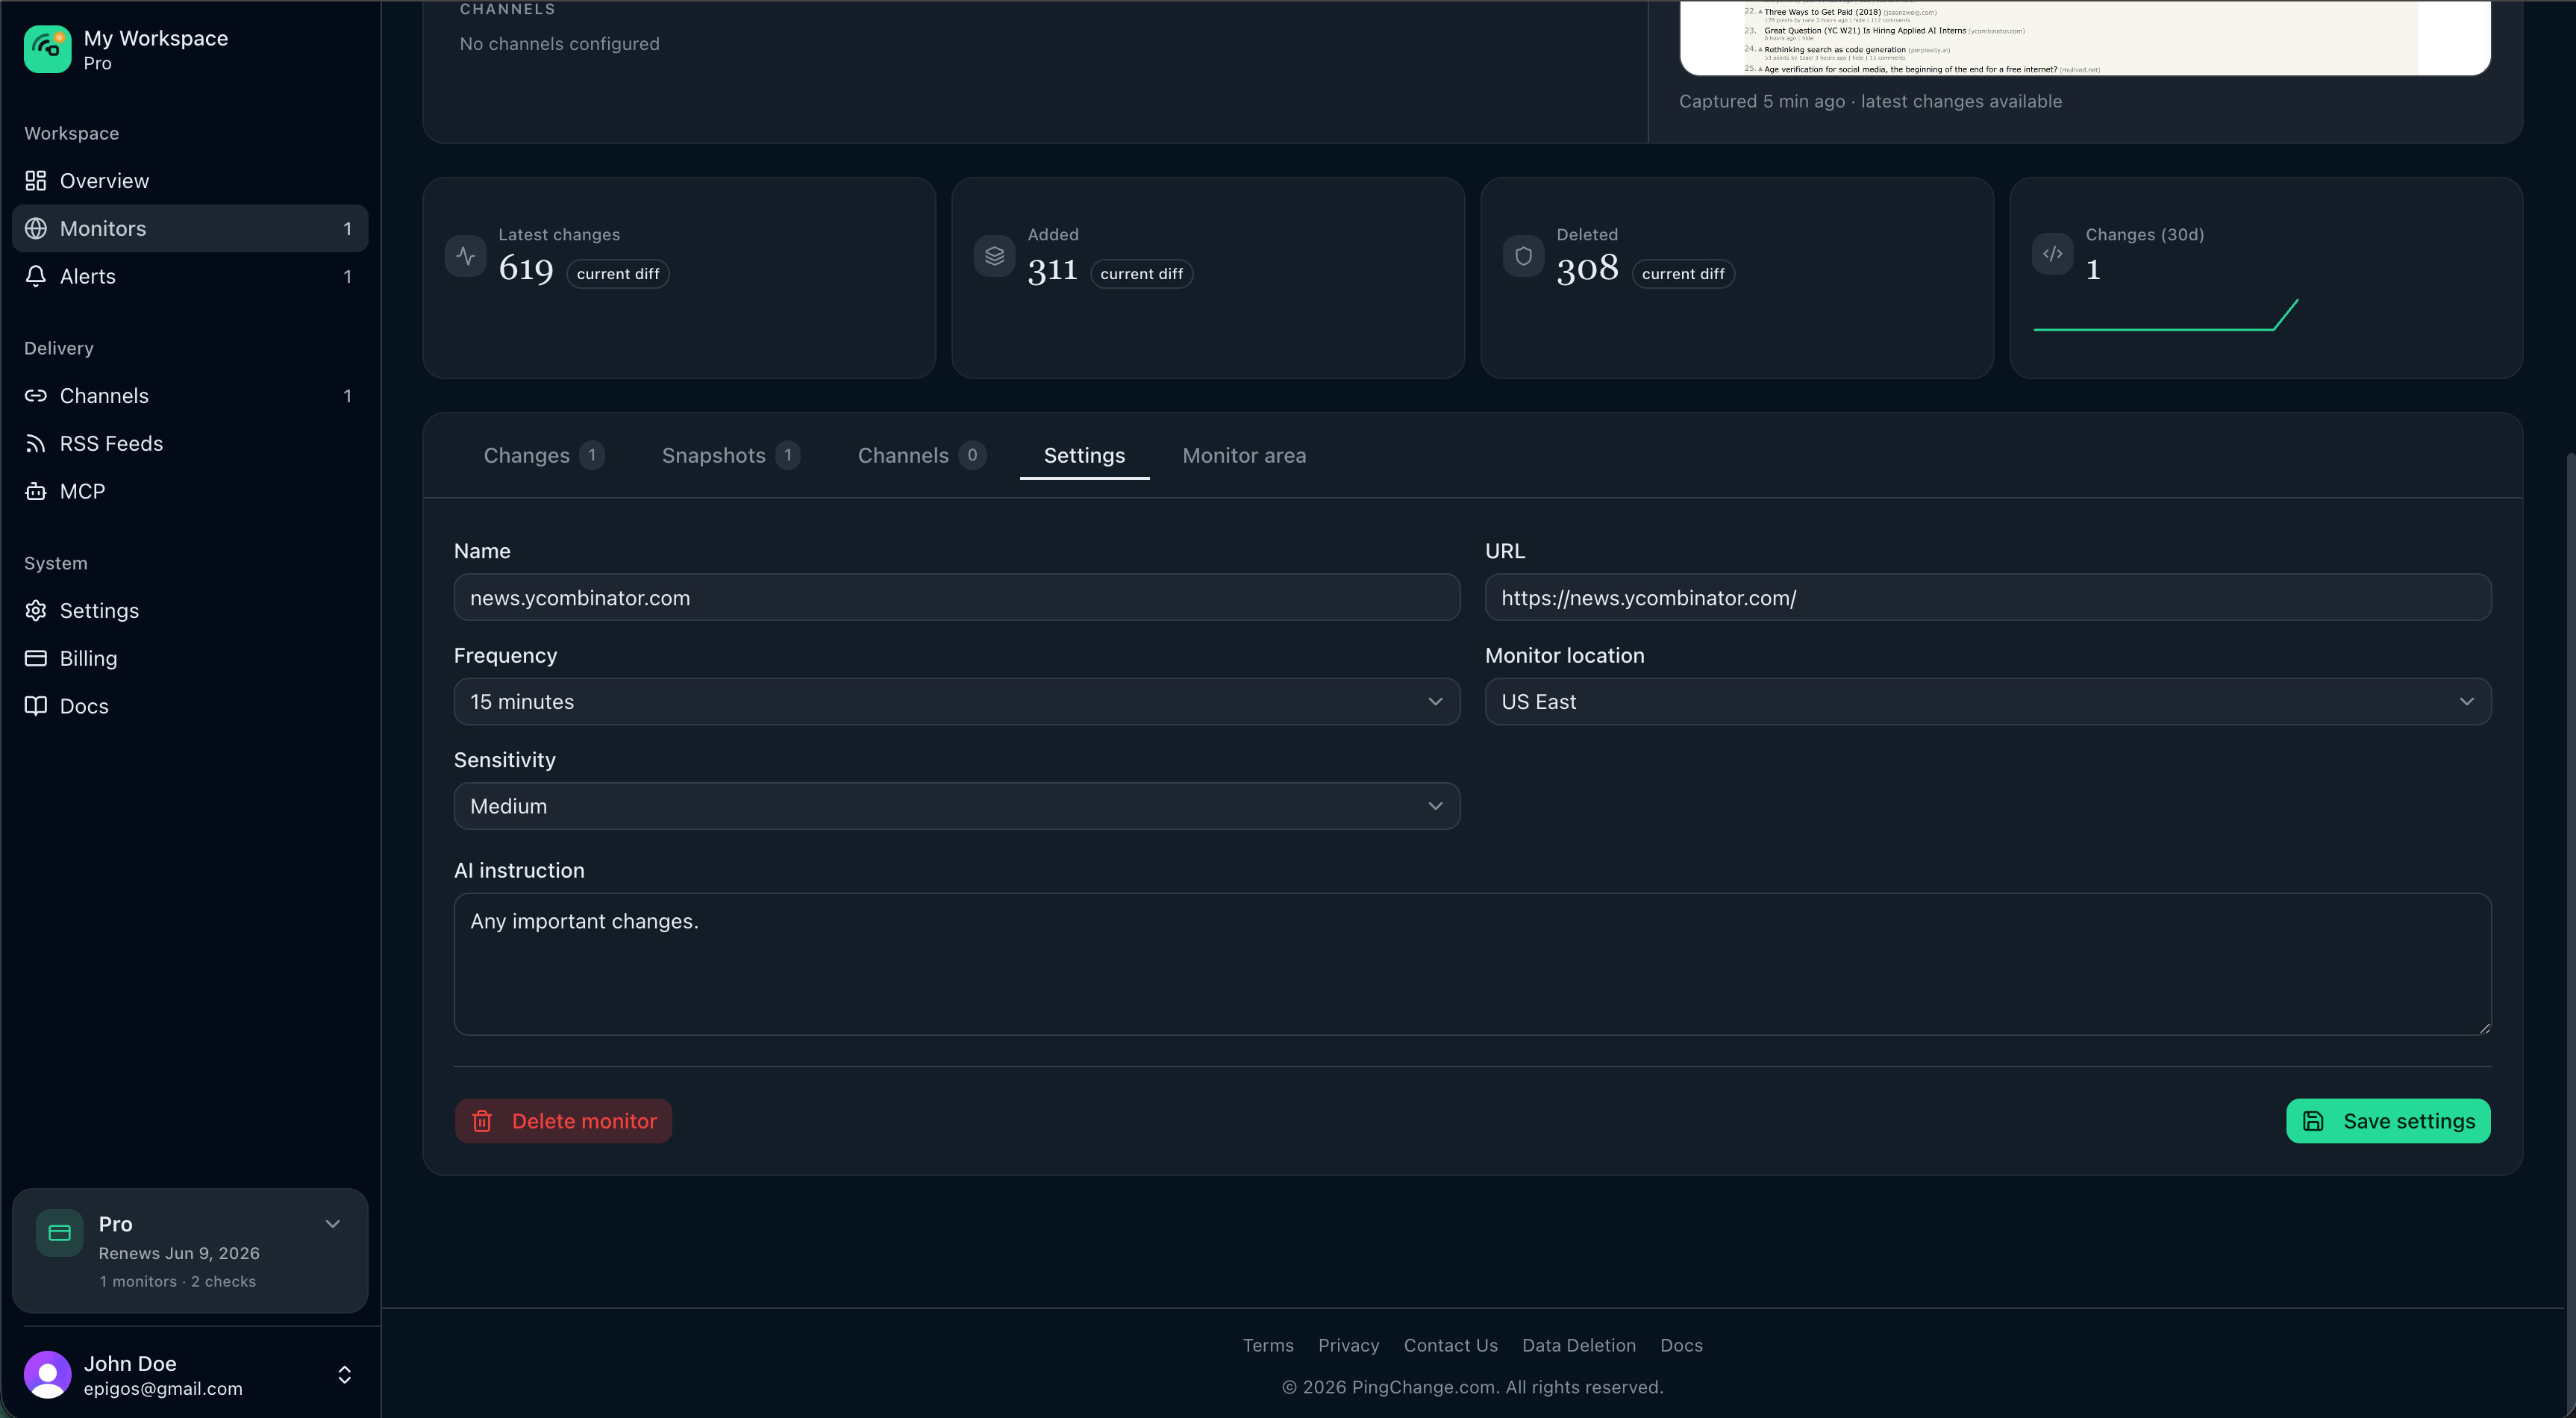
Use Settings to change a monitor without recreating it. You can also click Edit in the summary header; that switches to Settings and scrolls the tab into view.
Typical fields:
- Name and URL
- Frequency — How often checks run (plan limits apply to the shortest intervals).
- Monitor location — Where we load the page from (paid plans; see Geolocation monitoring).
- Sensitivity — How aggressively we treat small HTML differences as changes.
- AI instruction — Plain-language rules for what should count as an alert (paid plans; see AI-assisted monitoring).
Click Save settings when you are done. Use Delete monitor to remove the monitor and its history from the workspace (channels themselves are kept).
For deeper guidance on each option after setup, see Configure monitors.
View changes and diffs
The Changes tab is your audit trail for one monitor. Each row shows:
- When the change was detected (date and time).
- Severity — How the change is classified (add, remove, modify, breaking).
- Summary — AI-assisted or automatic text describing what changed.
- Keywords — Short tags when the system extracted them.
- Stats — Counts such as lines or elements added, removed, or modified.
Click a row (or use View latest changes from the header) to open the full diff for that check.
Diff detail page
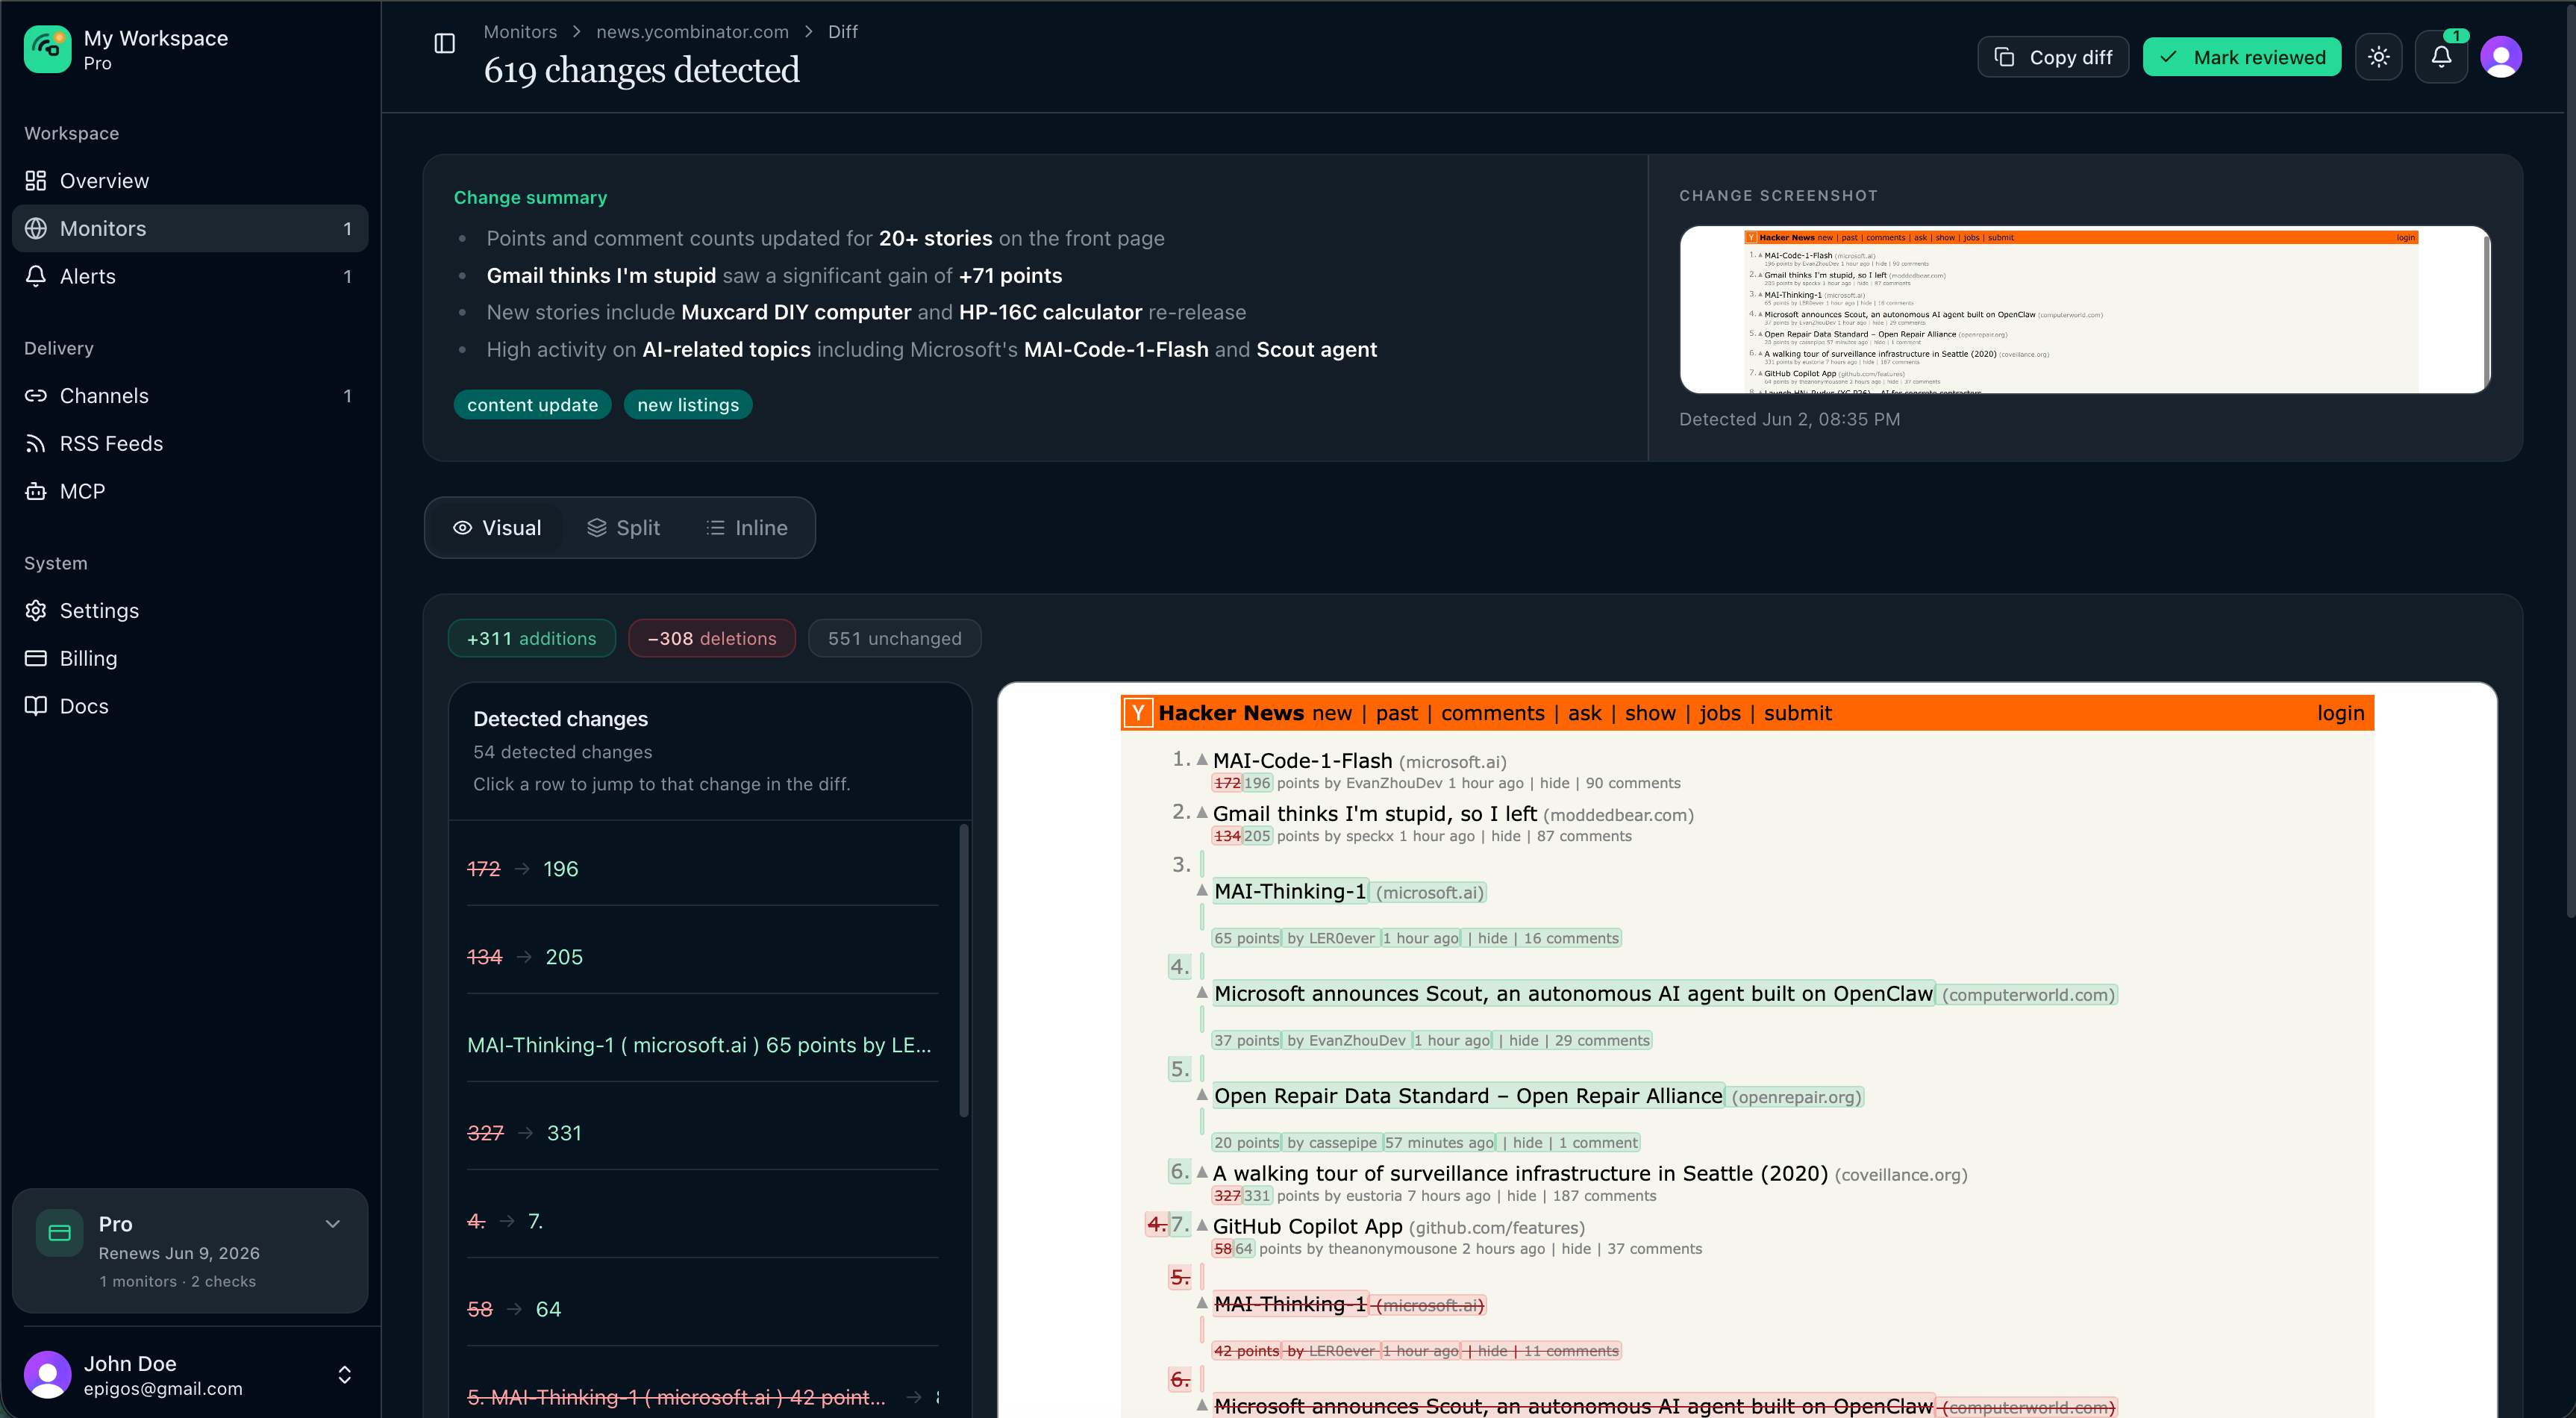
On the diff page you get:
- Change summary — Readable explanation and keyword chips.
- Change screenshot — For webpage monitors, a thumbnail of the captured page when a screenshot was stored (click to open full size).
- Comparison views — Switch how you read the underlying change:
- Visual — Highlighted before/after in the page (web) or structured API diff panels.
- Split — Side-by-side Before and After snapshots (web) or split JSON diff (API spec).
- Inline — Unified inline diff for text or schema lines.
Use Copy diff to paste the raw comparison, or Mark reviewed when your team has triaged the alert.
API spec monitors use the same flow; the comparison area shows endpoint and schema changes instead of HTML snapshots. See Alerts & history for how diffs relate to notifications.
Exports and feeds from the list
From the monitors toolbar you can open Export for workspace-wide CSV or JSON downloads and workspace RSS links. Per-monitor export and RSS live on the monitor detail page.